“Lake info” menu: level, depths, temperature, currents and waves
User guide · updated 19.10.2026
The state of the lake itself: today's level, its bottom, the water temperature, its currents and its waves.
What this menu is for
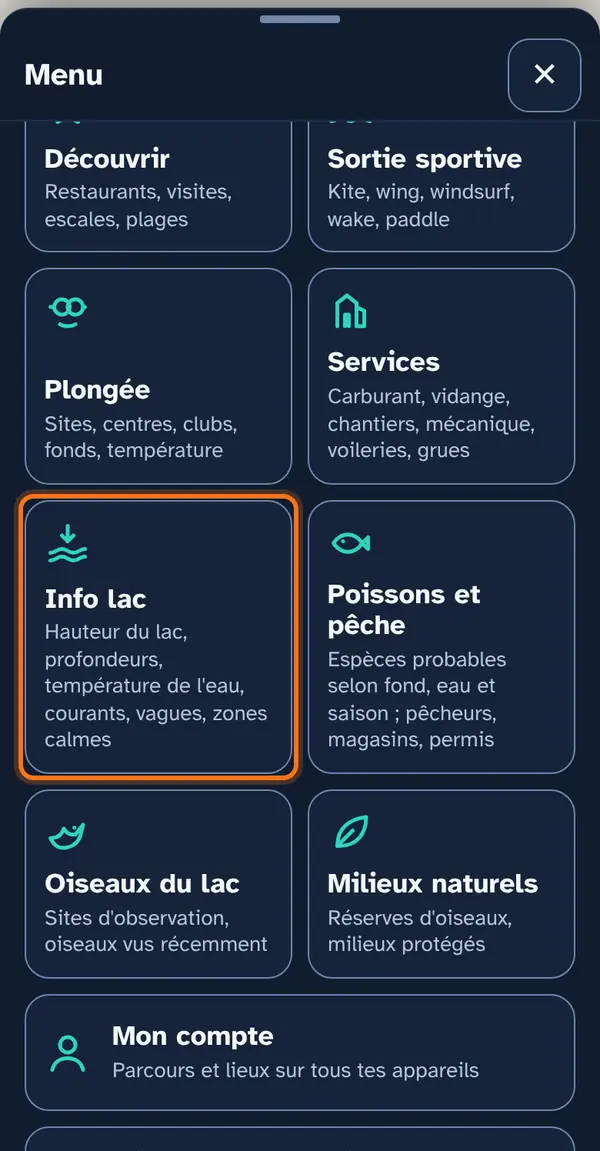
At the top, the current lake level: the average of the Federal Office for the Environment (FOEN) stations, with the time of measurement; it needs a network connection. Below, a simple list of map layers, with no submenu: depths, relief, temperature, currents, waves, calm areas and the sailing summary.
How to use it
Open the menu
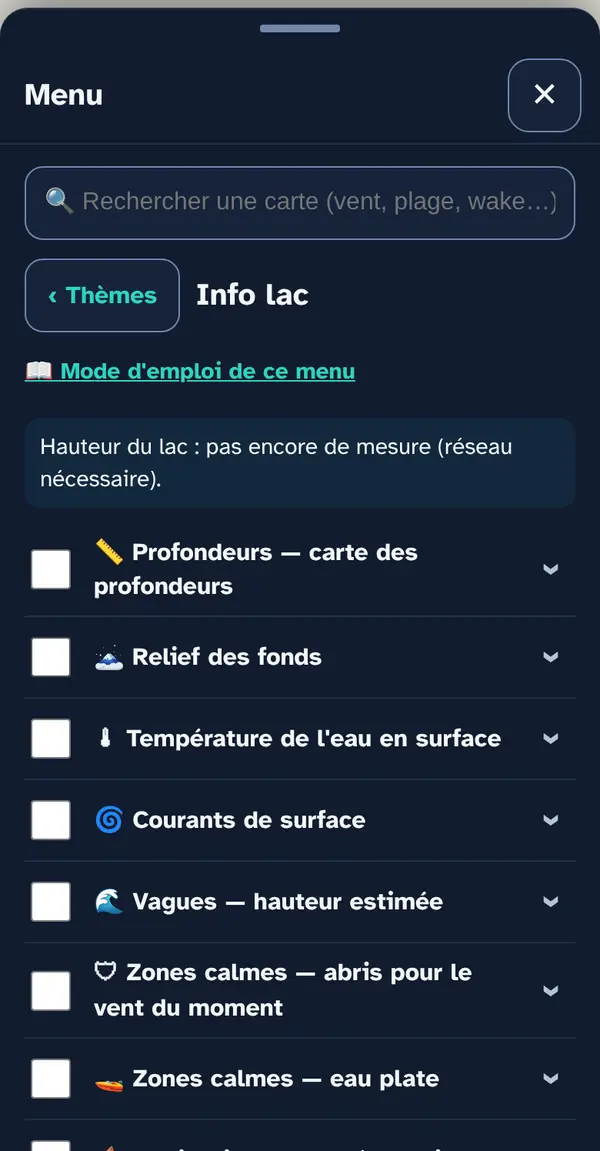
Tap Menu, bottom right, then the menu's tile. At the top: 📖 User guide for this menu (this page) and ↺ Reset maps, which switches everything off at once.
Turn on a map layer
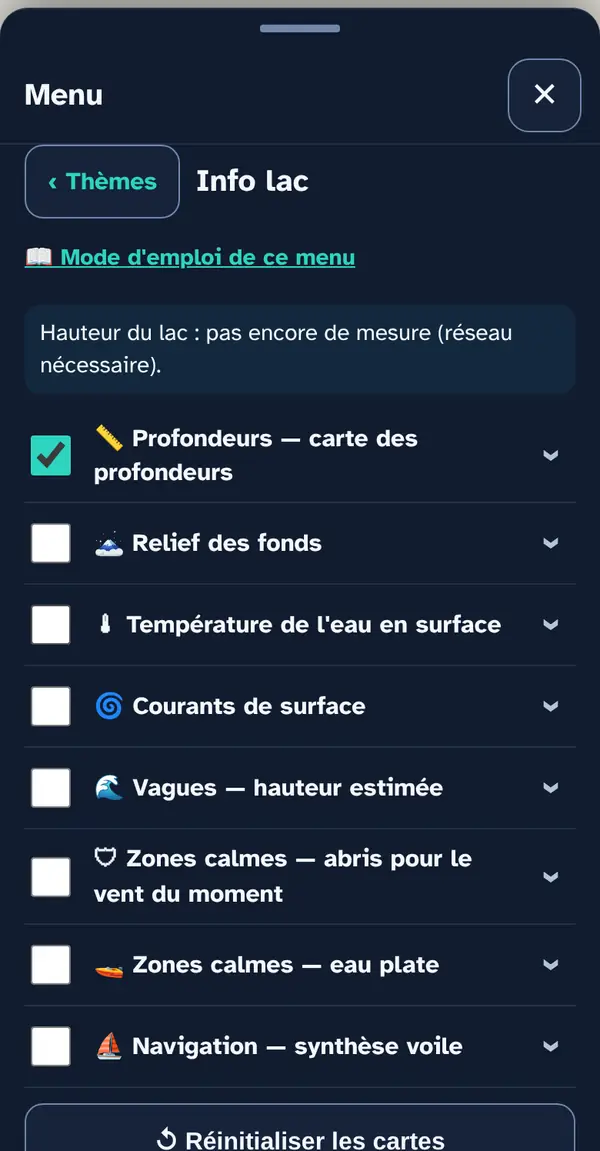
Tick a map layer's box to lay it over the base map; untick it to remove it. The arrow at the right of the row opens its info note: what the layer shows, its colour key, its source and what it doesn't tell you. An OFFLINE label marks a layer built into the app, which works without signal.
Why checkboxes? So that only what's useful right now goes on the map: ten layers switched on together become unreadable.
Reading the map
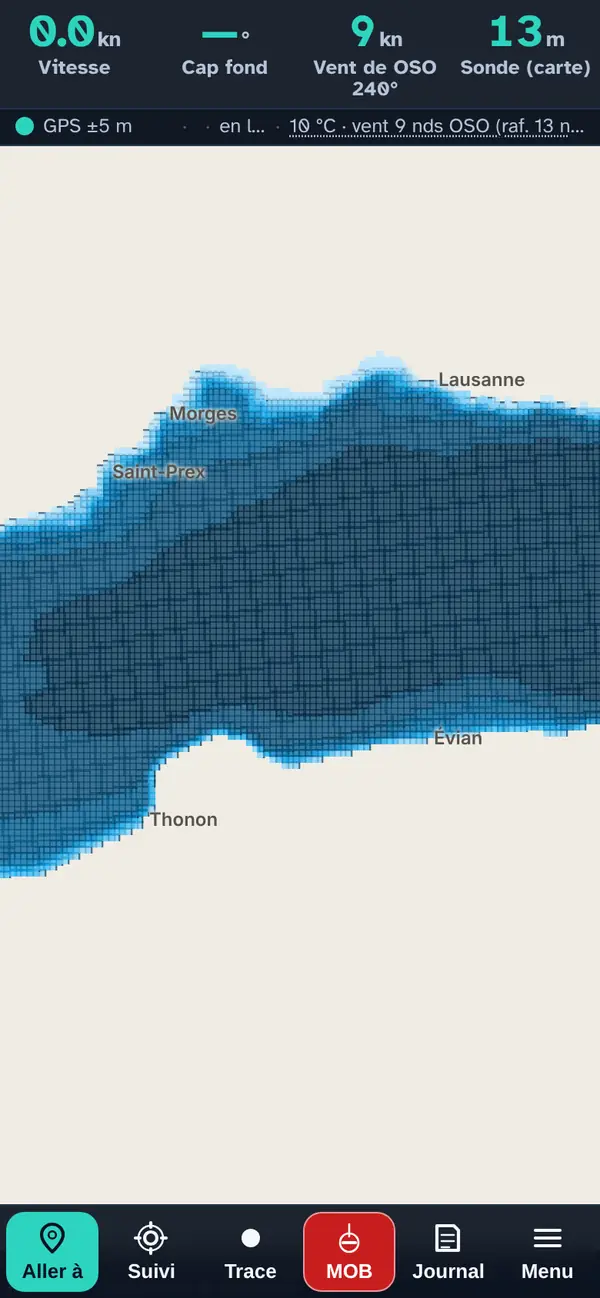
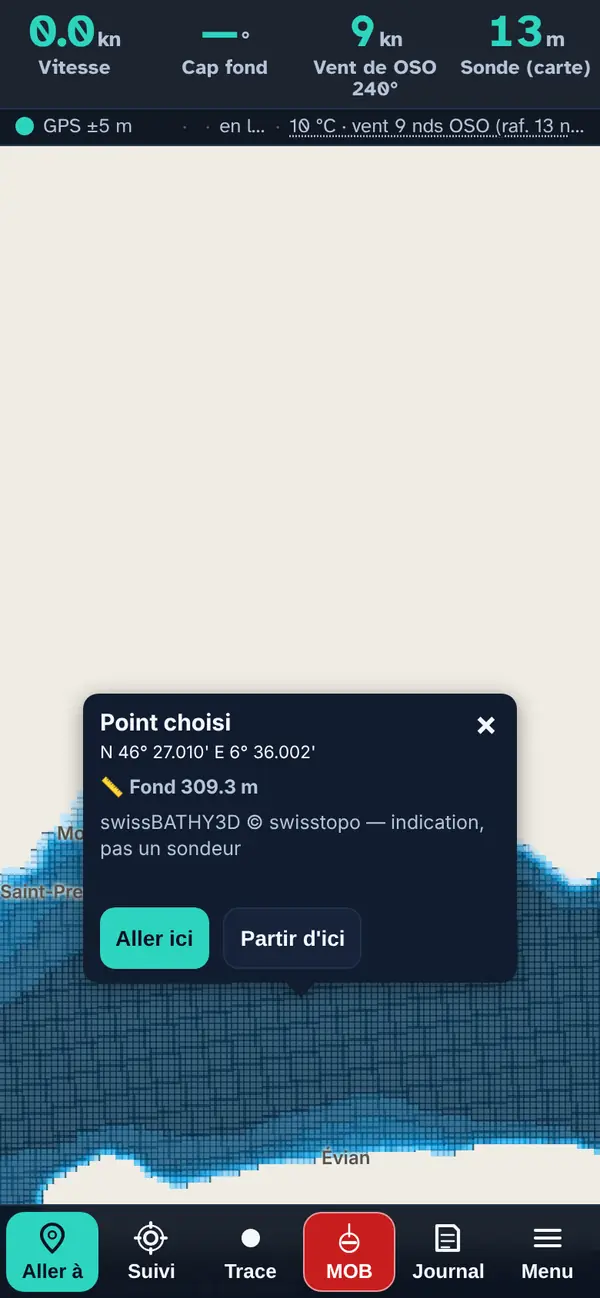
“Depths — depth map”: the whole lake in colour bands, from light blue (less than 2 m) to midnight blue (more than 200 m). The boundaries between two bands trace the contour lines.
Tap a point: the pop-up
With a depth map switched on, the Selected point pop-up gives the average depth of the 50 m grid cell and the highest point within it, taking today's lake level into account. With temperature or currents, it adds their value at that point.
How the data is cross-checked
Depths come from swissBATHY3D (swisstopo), built into the app: a 50 m grid over the whole lake, corrected for today's level measured by the FOEN. Surface temperature and currents come from the Eawag 3D model, in three-hour slots; waves and calm areas are calculated in the app from the forecast wind and the fetch (see Sports outing). The sailing summary adds the wind (25 knots count as much as 50 cm of wave) and the Eawag current. All of them follow the time slider.
The map layers in this menu
Forecast maps (wind, rain, currents, waves, water temperature…) bring up a time slider at the bottom of the screen: drag the slider and they are recalculated for the chosen time.
📏 Depths — depth map
The whole lake basin in colour, in 200 m cells. When two neighbouring cells fall in different bands, the boundary is highlighted: you get the depth contours without having to calculate them.
Tip. Tap the map to read the exact depth at a point; the legend gives the bands in metres.
Good to know. A 50 m cell won't show an isolated rock, a wreck or a recent bank. It is not an echo sounder.
Source: swissBATHY3D © swisstopo, grid built into the app · today's lake level applied
🗻 Lakebed relief
A very fine hillshade of the underwater relief across the whole of Lake Geneva.
Tip. An image to understand the shape of the bottom: drop-offs, basins, deltas.
Good to know. No figures: it is an image of the relief, and it needs a network connection.
Source: swisstopo, tiles served online
🌡 Surface water temperature
Water temperature 1 m below the surface, across the whole lake, in three-hour slots. The time slider follows the cursor.
Tip. For swimming, diving and fishing: the temperature at 1 m, in three-hour slots.
Good to know. A model, not a measurement: near a river mouth, an outfall or in a shallow bay, the actual water can differ by several degrees. For the depth profile, see Menu › Diving.
Source: Eawag 3D Delft3D-Flow model, via the Alplakes API
🌀 Surface currents
The surface current 1 m below the water, as arrows, in three-hour slots.
Tip. Useful for a long leg or drift: 0,15 m/s across for an hour is more than 500 m.
Good to know. A model: it ignores the local current at a river mouth after a flood.
Source: Eawag 3D Delft3D-Flow model, via the Alplakes API
🌊 Waves — estimated height
Wave height estimated from the wind and the fetch. The time slider drives this layer: drag it and everything is recalculated.
Tip. Drag the time slider to the time you'll be heading back: that's often when the chop builds.
Source: Local calculation: Open-Meteo wind (ICON-CH1), swissBATHY3D shoreline and depths, current from the Eawag model. The fetch is calculated cell by cell in the app.
🛡 Calm areas — shelter from the current wind
Shelter from the wind shown: the areas the shore protects from the prevailing wind at that hour. The time slider drives this layer: drag it and everything is recalculated.
Tip. Shelter changes with the wind: check it for the time you'll arrive, not the time you set off.
Source: Local calculation: Open-Meteo wind (ICON-CH1), swissBATHY3D shoreline and depths, current from the Eawag model. The fetch is calculated cell by cell in the app.
🚤 Calm areas — flat water
Flat-water areas at the time shown: little wind and above all little fetch, so no chop has built up. The time slider drives this layer: drag it and everything is recalculated.
Tip. Look for green: flat water, waves under 10 cm.
Source: Local calculation: Open-Meteo wind (ICON-CH1), swissBATHY3D shoreline and depths, current from the Eawag model. The fetch is calculated cell by cell in the app.
What you need to know about these maps
Wave height is an ESTIMATE using the Sverdrup-Munk-Bretschneider formula, never a measurement: it ignores residual swell, gusts and cross-chop after a wind shift.
What this menu tells you, and what it doesn't
What it tells you. Today's measured level, the bottom modelled from swissBATHY3D, the water and currents modelled by Eawag, the calculated waves.
What it doesn't tell you. No echo sounder, no nautical chart, no on-site water measurement: everything except the lake level comes from a model or a calculation.
Navleman is a navigation aid, not an official nautical document: the official chart, the storm warning lights and the authorities' instructions always take precedence.